System Mapping in Action: Deforestation in Peru
How can System Mapping help to understand a complex issue? Together with UNDP Peru, we developed a participatory System Map to understand, discuss and improve deforestation in the Peruvian Amazon.

Almost 60% of Peru`s national territory is part of the Amazon. The Peruvian forest is home to a huge diversity of plants and birds, provides livelihoods to indigenous communities and is an important balance for the local climate. In recent years, however, the forest has been regarded as a barrier to economic development — especially in regions with dire socio-economic situations.
UNDP Peru is one of the local agents trying to reverse the trend. They are actively cooperating with the stakeholders from government, private sector and civil society and are aiming to show a way how sustainability and economic productivity can — and have to — work together.
To support UNDP Peru in navigating the complexity, we teamed up with our friends from Sensemakers Collective to lead a participatory System Mapping project. Together with UNDP and local stakeholders we asked ourselves: What is driving current deforestation? And how can we build a sustainable, productive landscape?
Our Process to System Mapping
We understand System Mapping as a visual language to make sense of complex problems and to develop a deep, shared understanding of what happened and why. We designed and planned the project along our five-step System Mapping process. It’s never as linear and clean as it looks in the graphic but it gives us an orientation to not get lost in the complexity.
If System Mapping and Systems Thinking is completely new territory for you, I can recommend our previous article to get a quick introduction: Systems Thinking — What is it all about? If you are curious to try the process yourself, feel free to use our online toolkit as a guideline to develop your first System Maps: system-mapping.com/toolkit
1— Frame: What is our scope?
In the beginning, we need to be clear about the focus and goals of the mapping — just as in any other collaborative work. Our project focused on two regions in Peru, Uyacali and Huánuco, where socio-economic development is slowly improving but comes at a large expense of the Amazon forest where deforestation increased sharply: According to Global Forest Watch, Ucayali lost 5% of its primary forest between 2000 and 2020 while Huánuco lost 18% in the same period. In the last years, deforestation slowed down but still remains at a high level.

In the framing workshop with the UNDP core team, we identified important stakeholders, set the boundary for our system exploration and defined the main goals for the project:
- Visualize and structure the drivers contributing to deforestation
- Bring together local stakeholders and help them to share and empathize with each other’s perspectives
- Find leverage points where UNDP and local stakeholders can work together to make a positive change
2—Explore: What contributes to the problem?
After setting the scope, we dove into the research and initial discussion to identify important drivers and overall themes that help us to understand the level of deforestation.
Together with UNDP and selected stakeholders, we collected causes that might contribute to deforestation and the effects of the ecosystem change. By clustering the variables, four larger themes emerged and we captured hypotheses of how they might form a piece of the puzzle to our problem:
- Agricultural production is the economic driver of the regions but agricultural expansion is a main factor for forest loss.
- Financial instruments and market demand create incentives for production but not enough for sustainable practice.
- Effective forest and land governance reduces deforestation but is undermined by land trafficking.
- Illegal activities provide alternative income sources but are a contributor to deforestation and violence within the area.

3 — Map: How does it all relate to each other?
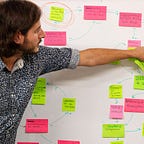
The climax of the project was our three-day System Mapping workshop in Pucallpa, Peru. Located at the edge of the Amazonian jungle, we invited stakeholders from local government, indigenous communities, farmer organizations, and civil society to share their experiences and to develop a better understanding of the overall system.
After introducing the methodology and building rapport for the overall themes, we divided the participants into groups to dive into and map the individual themes. In groups with 8–10 participants, we discussed and extended the initial variables and started to connect them.
Mapping is always the most exciting and the most intensive phase: What are causes? What are effects? How is it connected? What is important and what can we leave out? Patient facilitation helps to make everyone comfortable with the new, visual language and to translate the thoughts into the map. As soon as the participants got used to it, the discussions picked up pace and the variables of the themes slowly grew into a first map.

The exchange on variables and causal dependencies quickly revealed new insights about the dynamics of the system. It became obvious that indigenous communities are one of the protectors of the forest and learned to live in balance with the natural environment. However, they are also one of the largest victims of the current development: their natural habitat is destroyed and farmers invade their “protected” land to plant coca or mine gold. Conflicts increase and young members leave the communities as their perspectives are vanishing. We included indigenous communities as the fifth core theme to reflect their central role within the system.

4 — Reflect: How does this explain the issue?
The stakeholder workshop was full of discussions, new information and perspectives. The reflect phase allowed us to take a step back and to review not only the collective knowledge within each theme but also the dependencies between the themes. This helped us to unveil the larger stories that emerged within the system.
Together with the UNDP team and selected stakeholders, we reviewed the workshop results and identified feedback loops and general patterns. In the production sub-system, for example, farmers told us that they “have to deforest to survive” as in some regions farming is the only reliable source of income. They deforest land to increase their production to provide for them and their families.
On an individual basis, this is highly relatable and when a farmer secure a basic income the need to deforest decreases (B1). On a systemic level, however, several short- and long-term side effects amplify the expansion of farms and hence the on-going destruction of the forest:
- The loss of forest cover has several environmental effects (e.g. soil degradation, water scarcity) that reduce the productivity of land (R18)
- The sense of income opportunities increase economic migration from areas with worse situations. These new farmers also need deforested land to start making a living as farmers. (B3)
- With more farmers and slowly increasing demand, the competition between farmers increase and profits decline (R2)
- Seeing everyone in the area deforest to expand land, a culture of deforestation is established and the consequences are ignored (R4)

This kind of “bounded rationality” is a common phenomenon within complex systems: Stakeholders act rationally based on their (bounded) perspective on the system. Developing a system understanding collectively, can help these actors to become aware of their role in the wider system and how the side-effects might come back at them.
5— Leverage: What can we do?
As one of the main project goals was to communicate the map and share the perspectives from the system, we developed an online version of the map on Kumu (Link). We also used the built-in functionality of Kumu to create an online presentation (Link) to make the map more accessible for stakeholders who were not part of the workshop. We added an English version of the map (Link) to share insights with other regions who find themselves in different contexts but with similar system dynamics.
The full system map can sometimes be overwhelming for a first-time viewer. Besides the online presentation, we therefore created a simplified, high-level map of the different sectors to provide a quick overview of the sectors and the key dynamics in the system:

Based on the insights, we started to derive potential leverage points: Places in the system where a small change could impact the system as a whole. The focus of the project lied on the collective sense-making and sharing of the system insights. We still looked at potential impact chains and identified areas that should be considered when developing new policy approaches in the future:
- How might we incentivize farmers to increase the productivity of their lands rather than expanding into forested areas?
- How might we enable financiers and investors to provide frameworks that are suitable for farmers and indigenous communities?
- How might we strengthen indigenous communities in their abilities to live in and protect the forest?
- How might we enable farmers and communities in producing and selling commodities that are sustainable?
The leverage points can provide a starting point to develop new policy ideas and paths to transform the system. Knowing that the map is always a simplification, we also identified knowledge gaps (e.g. additional drivers of migration) and defined needs for further research (e.g. governmental concessions for large companies).
Conclusion
The System Map gives us an overview of the main feedback loops and dynamics that contribute to the on-going deforestation in the Peruvian regions of Uyacali and Huánuco. It is a first step to gain a birds-eye view on deforestation and to unveil the network of causes and effects between various topics such as agricultural production, access to finance, and land grabbing.
System Mapping is not just about the final map but also about the process, the exchange and learning along the way. In this project, the process gave a voice to stakeholders, allowed everyone to see the connections and to better understand their role within the system.
“System Mapping as a tool and as a process were highly valuable for our work. For us, the map is a summary of reality and it helps us to see the problems and relationships more clearly. The process allowed us to bring together stakeholders, hear new perspectives and build coalitions for action. The analysis sparked new ideas on how we can make the landscape more sustainable and productive and helped us to develop a more holistic theory of change.”
James Leslie — Technical Advisor on Ecosystems and Climate Change, UNDP Peru
We hope that our system journey can contribute a small part to the protection of rain forests in Peru: In order to change a system, we need to understand it. We are confident to see UNDP and regional stakeholders working together to improve the life of the local population while also giving a voice to “actors” in the ecosystems that are not heard enough: indigenous communities, the natural environment and future generations.

Thanks to the PPS team of UNDP Peru and particularly to Manuel Champa for the great collaboration throughout the whole process, for organizing the great on-site workshop in Peru and for not shying away from the complexity to make the Peruvian landscapes more sustainable.
And thanks to Malika from Sensemakers Collective for co-facilitating the workshops and building the open and trustful space for participants to share their thoughts freely.
About Me
I’m a systems modeler to help making sense of complex, dynamic systems. I’m the co-founder of the System Mapping Academy and a senior policy advisor for international development. I work with NGOs, government agencies and business organizations on diverse challenges from land use management in the Amazon to successful capacity development in organizations. I’m convinced that a system intelligence combining human experience, data analysis and adaptive learning can strengthen the long-term health of our social and environmental systems.
If you are interested to use Systems Thinking, we developed a toolkit to help kick-starting your first System Maps: system-mapping.com/toolkit
And if you want to learn more, we developed a training program to dive deeply into the world of Systems Thinking and System Mapping and how to apply it in practice: system-mapping.com/training