Systems Mapping: How Paris meets Climate Change
“Remember, always, that everything you know, and everything everyone knows, is only a model. Get your model out there where it can be viewed. Invite others to challenge your assumptions and add their own.”
― Donella H. Meadows, Thinking in Systems: A Primer
How does Paris attempt to decrease CO2 emissions and mitigate climate change? This is the key question asked in the article “Gärten statt Beton — So begegnet Paris dem Klimawandel” published in the Tagesspiegel (03.08.2019, Link to Original Article, Link to English Translation).
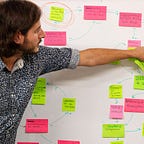
From a Systems Thinking perspective, the topic is highly relevant due to the interplay of different social, environmental and economic factors. That’s why we chose the article for our first “Systems Jam” to develop a map summarizing the causal essence of the article.
What are Systems? What is Systems Thinking?
We live in a world full of systems, dynamics and complexity. Being a neighbor, a colleague, a parent or a citizen, we move within systemic structures that guide our thinking and are affected by our actions. Some of those systems we learned to manage intuitively (e.g. having a shower, driving a car, eating lunch, preparing presentations). Others though are more complex and our intuition might guide us wrong (e.g. staying healthy, coping with stress, acting sustainably, raising a child, planning long-term climate mitigation).
Formally, a system is defined as an interconnected set of elements that is coherently organized in a way that achieves a particular function. Systems Thinking can help to improve decisions in complex situations. It is a mindset and a set of methods and tools to understand the structures of complex systems and develop effective actions which improve the whole rather than single parts (read here for more information about Systems Thinking). One tool frequently used is the System Map.
What is a System Map? Why is it useful?
Based on a defined goal or problem, the System Map (or Causal Loop Diagram) provides an overview of important factors and their causal connections. The map unveils the most important characteristic to understand a system: feedback loops. The emergent behavior from feedback loops is what guides a system and determines its long-term development. Balancing loops keep systems stable, while reinforcing loops can lead to significant systemic change.
From a cognitive perspective, the map supports us in understanding the underlying structure of a system and in developing a narrative about how the problem arose. By developing a causal summary, it allows to critically reflect on the topic, identify missing connections or think of factors which should be in the picture as well.
From a co-creation perspective, the map acts as a boundary object: it connects participants and bridges the gaps due to different functions or experience. Independent of the field of expertise, everyone can read a systems map and contribute to its development. Unveiling implicit assumptions, the map facilitates the debate and at the same time, nudges the participants to integrate their perspectives.
The map is not (and will never be) a perfect representation of the real world. It is rather a collection of the assumptions of how the system works through the eyes of the modellers, the participants and — in the case of mapping an article — the author.
System Map in Practice: Paris & Climate Change
In our example, we elicited the key factors and assumptions from the Tagesspiegel article and summarized them in a Systems Map. The map is not comprehensive and mainly reflects the variables mentioned in the article through the inherently biased eyes of the modeller team.
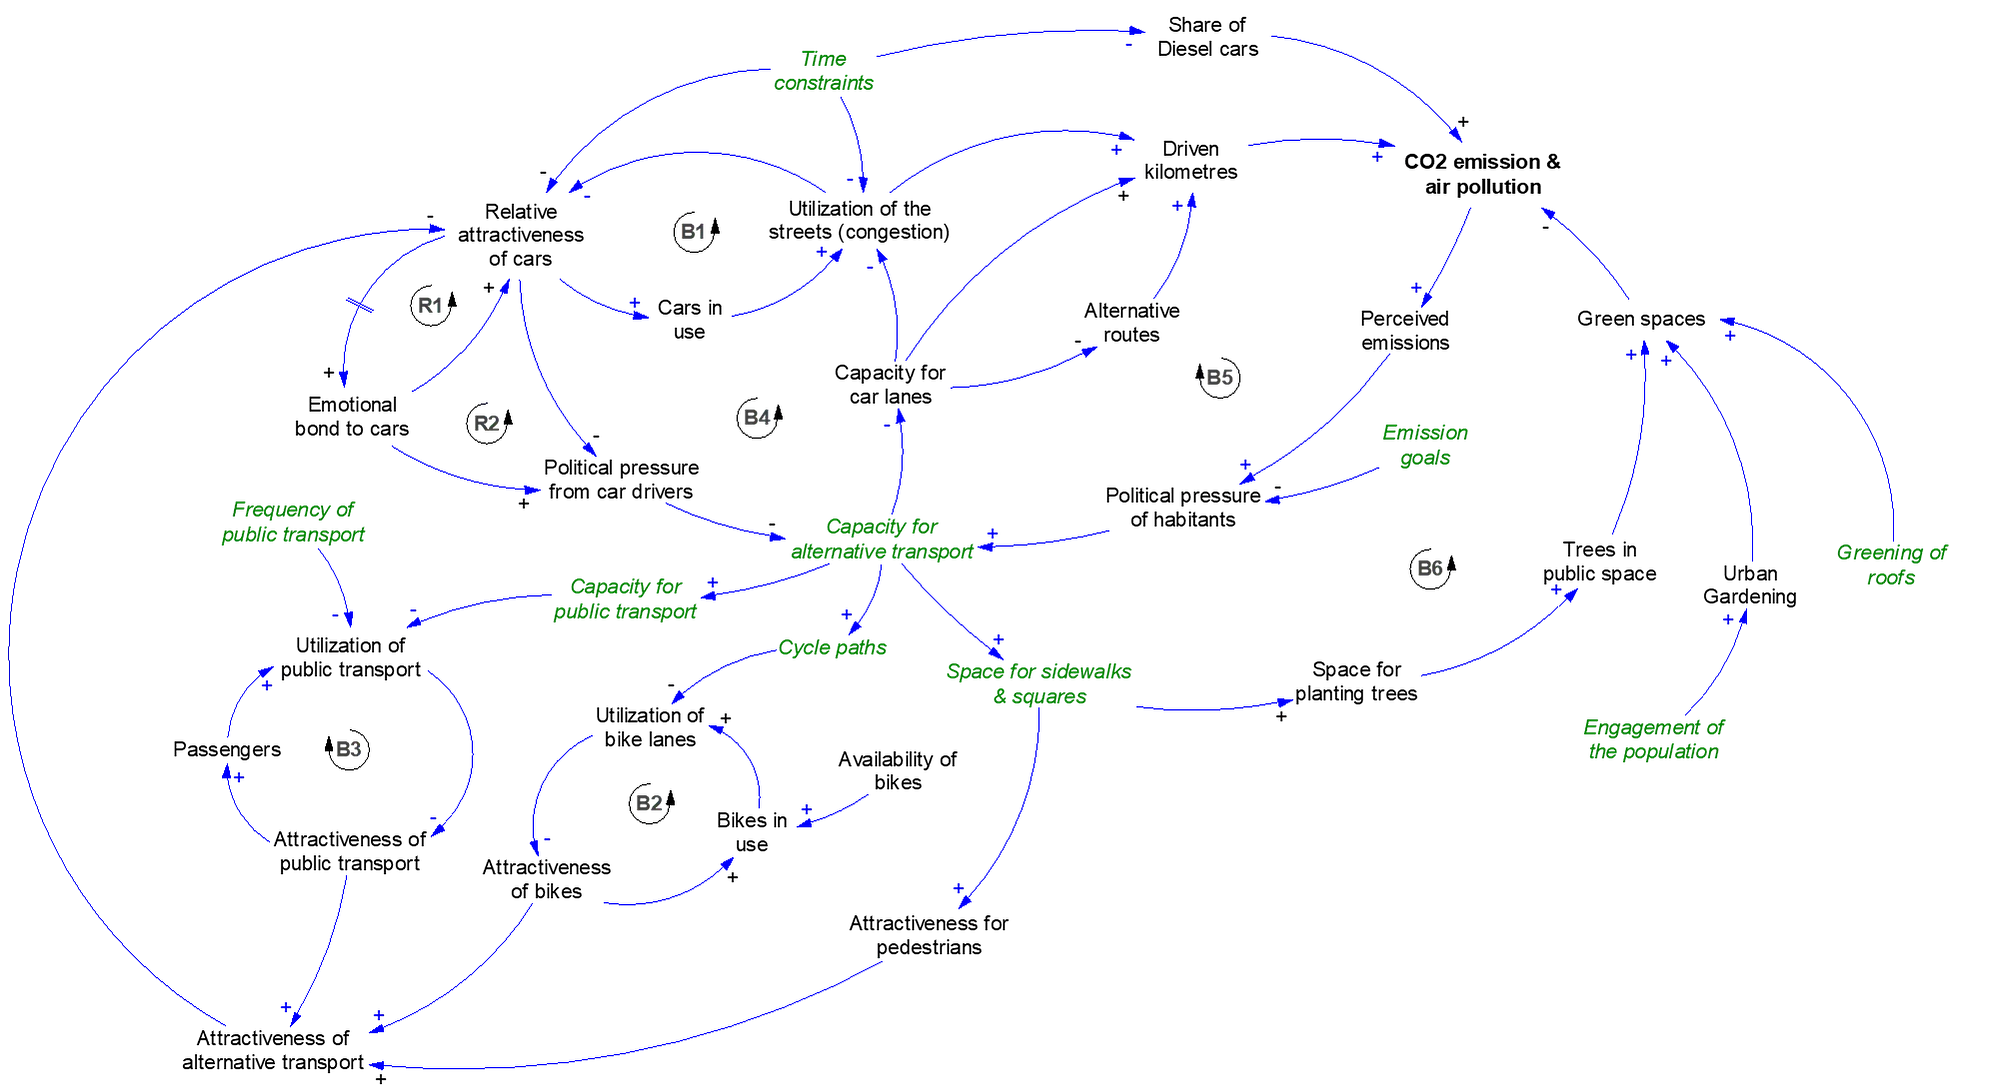
The map allows us to connect and critically reflect on the points made in the article. The first insight we gain is about the scope of the article. It mainly focuses on the efforts of Paris in the urban transport and green spaces to reduce CO2 emissions and improve air pollution respectively. Besides the introductory example of providing refreshments in public spaces, the article does not talk about policies for urban resilience to cope with the impact of climate change.
The map also makes the mentioned side-effects obvious. Although reducing the capacity of streets can help lower the CO2 emissions, the increased congestion on alternative roads as well as the additional kilometers due to sub-optimal routing counteracts the positive effect. Equally, the already high utilization rate of public transport decreases its attractiveness and limits the ability of public transport to become an alternative for car drivers.
The map shows us that the structure around the described policies mainly consists of balancing loops. B1, B2, B3 describe the loop between transport utilization and its attractiveness for cars, public transport and bikes respectively. B4, B5, B6 show the loops influencing political pressure. As balancing loops keep the system stable, these loops tend to absorb policy efforts and could hinder a wider change. The policies described hence would require constant effort for maintaining their initial impact.
We also identified two reinforcing loops (R1, R2) around the public image of cars in society. The more attractive and accepted cars are in the city, the higher their societal status and the emotional bond towards them. This can in turn lead to a higher attractiveness and build political pressure by car drivers if they feel restricted in their right to drive a car. But a reinforcing loop can work in two directions. If the emotional bond towards cars starts to decrease, this can initiate systemic change and reduce the amount of cars significantly. The change of societal perception though is a slow process and includes a significant delay. Only after time and constant efforts it might have the power to take on a life of its own.
As Dana Meadows stated in the introductory quote, a model should be used to embrace debate and understanding. So the question goes out to you, dear reader: Do you agree with the structure of the System Map? Which factors are you missing in the map? What additional connections could you think of? At which point in the system would you intervene? Where do similar problems and structures exist?
Developing a map marks the first step into the systems perspective and a first step on the long and winding learning curve to better understand how a system actually operates. Turning the systems map into a mathematical model and including available data measuring the variables over time can help us to validate the modeled assumptions and might bring us another step closer to systemic understanding.
About Me
I’m a systems modeler to help making sense of complex, dynamic systems. I’m the co-founder of the System Mapping Academy and a senior policy advisor for international development. I work with NGOs, government agencies and business organizations on diverse challenges from land use management in the Amazon to successful capacity development in organizations. I’m convinced by the combined powers of human experience, data analysis and adaptive learning to reach a systems intelligence that strengthens the long-term health of our social and environmental systems.
If you are interested to use Systems Thinking, we developed a toolkit to help kick-starting your first System Maps: system-mapping.com/toolkit
And if you want to learn more, we developed a training program to dive deeply into the world of Systems Thinking and System Mapping and how to apply it in practice: system-mapping.com/training